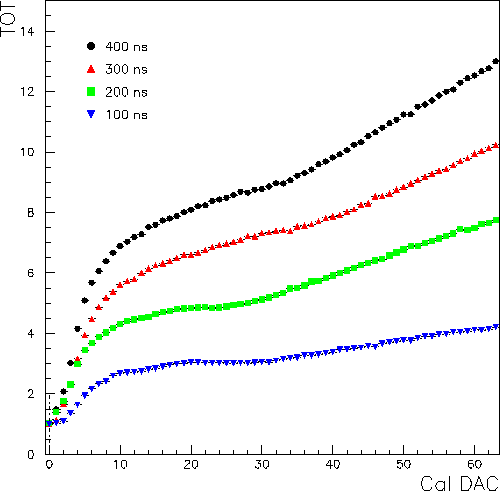
TOT Measurements
The plot below shows the average time over threshold (TOT) response to charge
injection at the four shaping times. The chips were set for no skip
for all four shaping times.
The data were taken with HDI H1-13
(DFA D02B-8) after bonding to the silicon.
The average TOT includes both sides (n and p) of the HDI, where
the p-side Cal DAC was converted by subtracting it from 63.
The threshold was set to 32 counts.
The data were taken with a clock speed of 40 MHz with a divide
by four. This means the pipeline was being filled at 10 MHz
so one TOT count corresponds to 100 ns.
The TOT dynamic range is from 1 to 15 counts. One Cal DAC count
corresponds to .48 fC of charge (from these
chip parameters).

![]()